From the last week of October to this day, the first Monday after election results (11/09); the market has seen a wild ride – and frankly so has my account -. With a new president being elected and the monetary / economic policy that is to be proposed and likely implemented, the market – and the economy – is set for BIG changes; to what extent these changes will be good? Only time can tell.
I will be walking you through some of my latest trades while sharing the ones that are currently under consideration, with a BONUS idea generated from one of my group members. All research PDFs will be linked throughout the article for your convenience, enjoy!
Why Equity Spreads?
Before I get started, I want to mention something before it possibly catches you by surprise, and that is the trading methodology that has been outperforming all other non-quantitative strategies in the past 10 years approximately; that of long/short equity portfolios.
This won’t be anything new for the experienced traders out there, though if you are starting out this will likely be a game changer for you as it was for me. The basic idea behind these portfolios is to eliminate as much risk as possible while keeping (and sometimes maximizing) your risk-adjusted return, this is extremely important to show on your track record as it can make or break your career as an individual trader or whether you want to raise investor money for a future fund. Let me explain how these trades work:
There are three basic type of trades that you can initiate in the equity markets, a market exposure position where you buy the $SPY for example and thus expose yourself to the S&P 500 itself plus all the sectors and stocks in it (riskiest). You can level down from there and take a sector trade like buying $VNQ or $XLE for example and exposing yourself to the real estate sector or the energy sector respectively (Not as risky, but still high risk as you are exposed to all of the stocks in the sector). Now with a sector trade you eliminate some of the market risk since if a sector opposite to yours collapses you can hedge out your investment while in a market trade that would be more difficult. Lastly we have a stock trade where you buy individual stocks and effectively eliminate most of the market risk and some of the sector risk as you are exposed only to the Beta that your stock holds and the corporate plan that your stock carries (e.g. what management plans to do). It goes beyond saying that this is the least risky trade of all.
Now that you know what type of trades and exposures you can get into, let’s talk about hedging in a long/short fashion shall we?
When you take a trade in the $SPY for example, you can hedge out the market risk by going against (short) an adjacent market like the $QQQ and thus trading the spread between the S&P 500 and the NASDAQ, problem is you are still exposed to sectors and stocks within those markets which might throw off either or. Taking a sector trade makes it a bit easier to hedge as in you can go long the information technology sector and short the oil and gas sector, these two have a history of negative correlation so you can hedge out some of the market and sector risk; problem comes when one stock in either sector has a huge surprise in earnings and brings the whole sector to a level you did not expect and now your sector spread is gone to hell. Lastly, taking a long/short trade in stocks within the same sector and market, you don’t have to worry about other stocks in the sector that much; or even where the market might go today for that matter as you will be Market and delta neutral (<– Click).
In this way, you effectively eliminate most of the risks involved in opening trades while also keeping a decent expected return, of course this involves further mathematical implications which I shall explain in later posts; but you get the point!
Onto the trades now…
$BAC / $GS

In this trade I looked to go long $BAC and short $GS the last time it hit the lower end of the range, made about 10-12% on the trade and got out at the top of the range as elections were coming up; though now that it is back at the bottom of the range I’m looking to go back in as my thesis is still valid.
To describe the trade that happened rather than the re-entry point, I decided to go into $BAC and against $GS for a couple of reasons. First, when the quarterly results came out, $BAC had experienced a more favorable Enterprise value dynamic (<– Click) where I like to define it as (Assets + Liabilities – Cash) as a basic view; $GS had declined by roughly 2.4% in its enterprise value vs $BAC.
Second reason was the power dynamic in the consumer sector, as more mortgages and personal loans are being opened due to the low interest rate environment, it only made sense that a consumer bank would see more volume and account openings than a higher-client base bank like Goldman Sachs would; thus narrowing my energy to BofA. Let’s look at some statistics now:
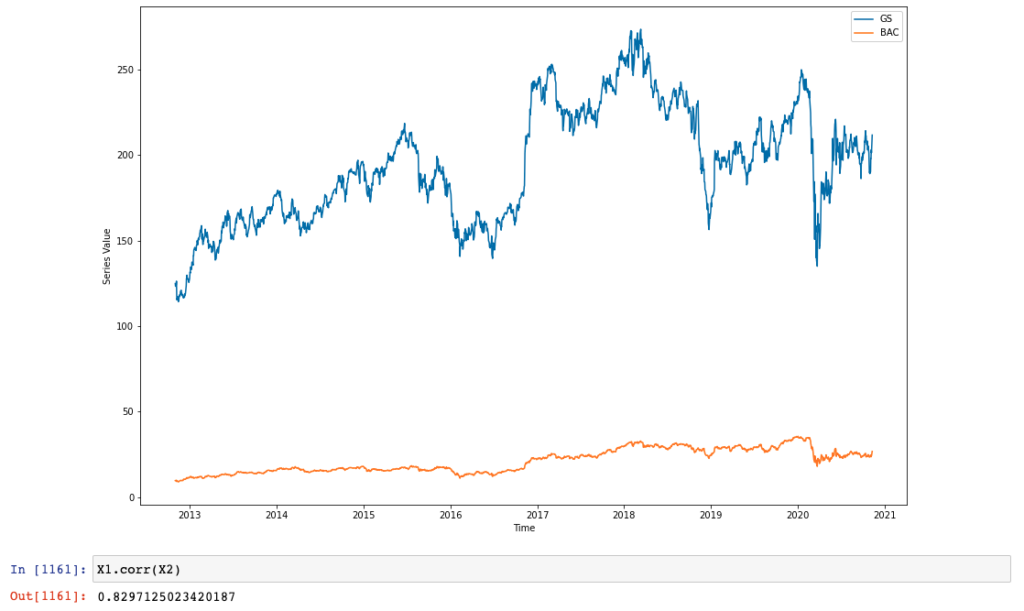
Yup, there you see a roughly 82.9% correlation between the two stocks in the span of 8 years, which makes their equity spread a favorable prospect of Stationarity (<– Click).
Given that the spread found itself in the lower range, shows high correlation and stationarity, and the fundamental/economic reasons checked out; I took the trade and profit an average of 8.5% from it (I say average because I average up as the trade starts going).
You can find a full PDF regarding this trade here (<– Click)
$CVCO / $KBH
A favorite of mine this month, with a whopping 12% return with close to 0 delta (close to no exposure to the market) made for a fantastic addition to my track record, let me explain why this trade was opened:
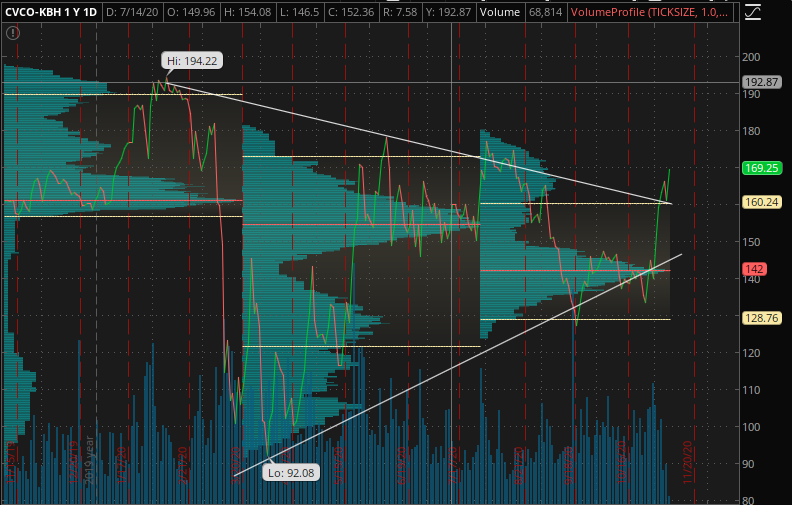
A little background on these two, $CVCO (Cavco Industries) makes factory-built homes that roll out in about a month instead of the traditional home process of 4-6 months when we talk about an entire community; such as the $KBH (KB Homes) process.
With the Coronavirus pandemic came lower interest rates and $1,200 checks, with those came a spree of home buying and refinancing of mortgages, such unexpected aggregate demand caught home builders and property managers by surprise. With many of the homes that were in the real estate supply now gone, home prices soared bringing the median home price to $300,000 (<– Click) which further intensified the buying as people wanted to now own a home and enjoy that sweet ride up. Problem is that homes went out faster than they came in and the spiking prices started to become a problem, more supply was needed… Quick *enter $CVCO*
Cavco in its ability to roll out homes faster than the traditional process that KB Homes possesses, took over most of the unexpected demand (mainly in the Northeast and South region) where building permits and housing starts were concentrated; so you bet I was all up on dat. Moreover, there was an interesting P/E ratio dynamic going on which is always something I pay attention to, $CVCO had a higher P/E than most home builders while $KBH had a lower one. Now MOST OF YOU will think that $KBH is “cheap” and $CVCO “Expensive”…. Complete nonsense.
The reasoning behind “cheap/expensive” is for long-term investors like Buffett or pension-funds, we’re here to trade in and out in the span of 1-3 months, we want QUALITY. The fact that the market is willing to pay a higher premium for $CVCO and not $KBH means that the former’s earnings will be of higher quality or will have higher demand in the near-future than the latter; which goes hand in hand with what I mentioned about non-quants using these sort of strategies; it has proven so as well in the performance. Let’s look at some statistics now:
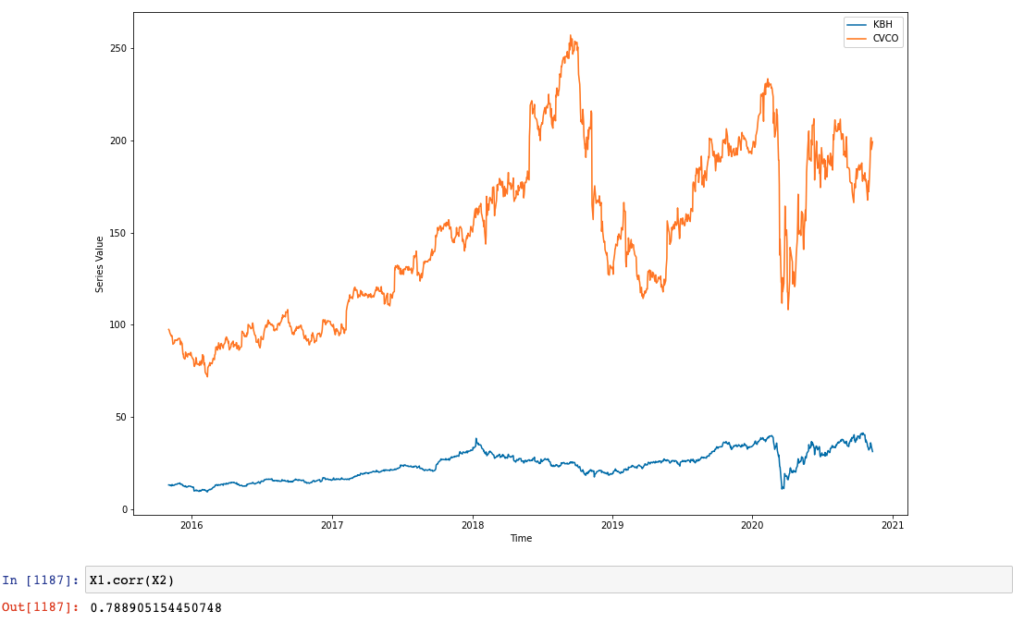
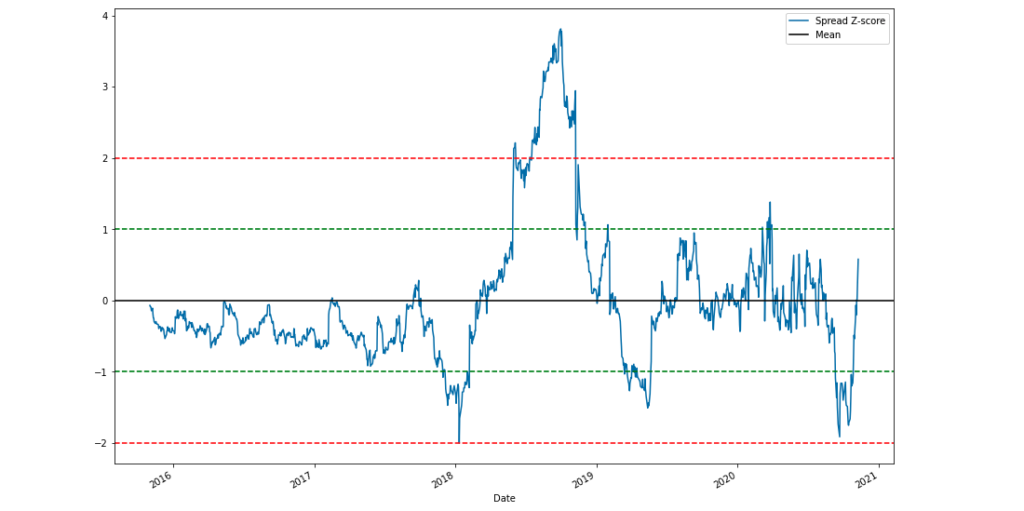
78% Correlation with a clear mean-reversion – or stationarity – trait, leaving us with a great set up with both fundamental/economic reasoning and statistical back up, can’t argue with the performance it has seen.
You can find a full PDF for this position Here (<– Click)
$ROST / $ZUMZ
Based on the past ISM Manufacturing report on business (<– Click) I noticed a good deal of value in the Apparel industry, specifically retail now that the value chain is leaving manufacturing. This however is a simpler trade than the previous but still worth mentioning.
Let’s start with the fact that people are scared about their incomes and job stability with everything that is going on with riots, Coronavirus, elections, and the McRib. Put yourself in the shoes of a scared average Joe, would you go out to Polo Ralph Lauren and purchase a $90 shirt? Or would you let the economic effect of substitution guide you to the cheaper alternative at least for the scary time being, like Ross? I know I would postpone shopping at the higher-end shops and get my goodies at Ross or Michael’s for that matter, if I’m thinking it so is the consumer.
We can corroborate this qualitative thinking by the fact that I’ve visited some Ross stores in Dallas, Destin, Orlando, and they were all packed while other department stores were empty and had huge liquidation sales! Other than this, consumer saving rate vs spending rate has decreased with spending focused toward the substitution effect mentioned above.
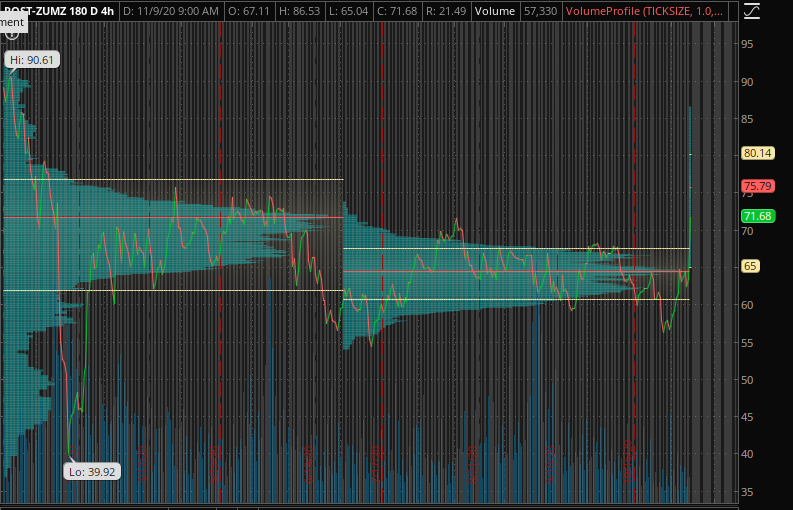
Now even though this trade returned an amazing profit (31%!!) it was a very small position as I’m not a retail focused trader and my knowledge base is stronger in other sectors; it only accounted for a 2% return on account (still not bad) Let’s look at some statistics:
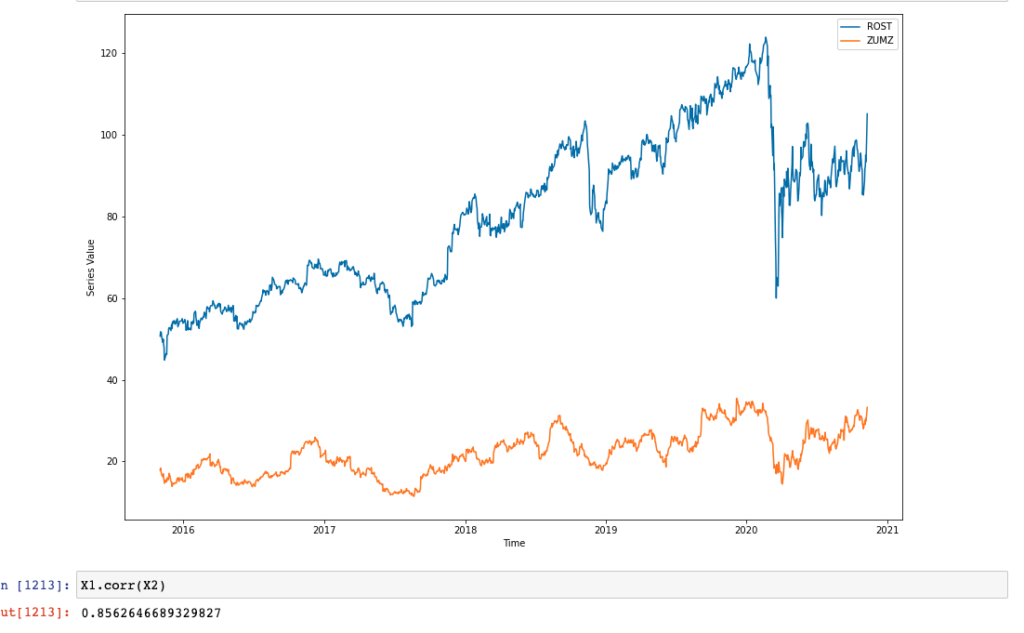
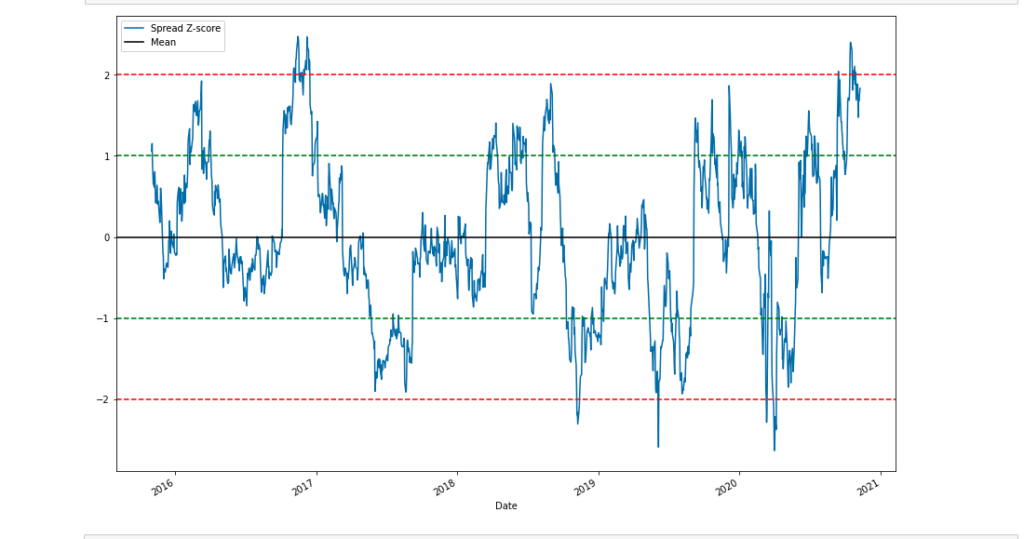
85.6% Correlation with Stationarity traits, Kick ass.
You can find a full PDF report for this position Here (<– Click).
Future Trades
I will make this one quick as a full report will be made on these once they are opened or in the aftermath of their closings. These will be focused primarily in the real estate sector and the Home furnishing / Property sales & management industries.
I will let you do the thinking and research on your own (mostly because PDFs aren’t out yet) but also because it’ll get your brain on the right frame. I want to start by laying out the past three months according to the ISM report on business and where the link is in the real estate value chain:
Let’s start with August, where due to the low-interest rate environment and an uptick in consumer confidence/spending, households and investors alike turned to real estate in a stampede toward the home supply; which ended up depleting faster than expected. We can confirm this by looking at the August ISM Manufacturing report (<– Click) and noting that real estate and construction inventories were the lowest! Moving on, those newly-sold homes needed things like furniture, bed-frames, shower curtains, appliances, blinders, etc. Turns out, retail stores selling these very items saw double digit growth in their hiring according to the August Employment Situation Report (<– Click)
Moving onto September, we can obviously see a complete carnage in inventories from the retail stores that sold all those new-home products, in turn these stores ramped up their new orders and of course this increased employment in the manufacturing sector for the products mentioned above; you can check out both statistics in the September ISM Manufacturing Report and the September Employment Situation Report (<– Click)
Lastly in October, we see an increase in hiring for specialty residential contractors (such contractors that lay concrete and get the assembly process ready for pre-construction) which is a reflection of the increased building permits nationwide and the need to increase the housing starts ASAP in order to stop home prices from spiking further. We see inventories for sale-ready products increase thus reflecting the expected demand that is to come from the new homes to be sold in the market, moreover; we see another double-digit hiring wave in these very retail stores. Check out the numbers in the October ISM Manufacturing Report and the October Employment Situation Report (<– Click)
All this put together tells us that the link in the Real Estate value chain is currently in the Home furnishing and Property Sales / Management industry for the sector, which is where we will be focusing our capital deployment in the following months.
Another sector we will be looking at is that of the Telecommunications Equipment since we see a rotation out of the tech sector with the new vaccine news and a revised Goldman Sachs Macro view (<– Click).
Conclusion
Trade smartly, carefully, and intelligently; do not ever start your ideas with looking at the charts (they will guide you in the wrong long-term direction I promise) instead, focus on what really drives the market and try to solve the puzzle for the next 3 months.
As always, feel free to write me in the Let’s Chat (<– Click) section, otherwise if you feel like emailing asking for the PDFs available in my LinkedIn (<– Click) you can shoot me an email letter for any advice you may need or further conversational purposes in the Why You’re Here (<– Click) Section!
Happy Trading & Good Luck!
Gabriel Osorio-Mazzilli.

